Hospital Ratings by Veterans Integrated Service Network
The VA is divided into 18 regional service areas known as Veterans Integrated Service Networks (VISNs). The purpose of these VISNs is to better facilitate local health needs and to increase patient access. Here is how each region fares based on star reviews on Google, Facebook, and VA produced hospital star ratings from the Strategic Analytics for Improvement and Learning (SAIL) dataset.
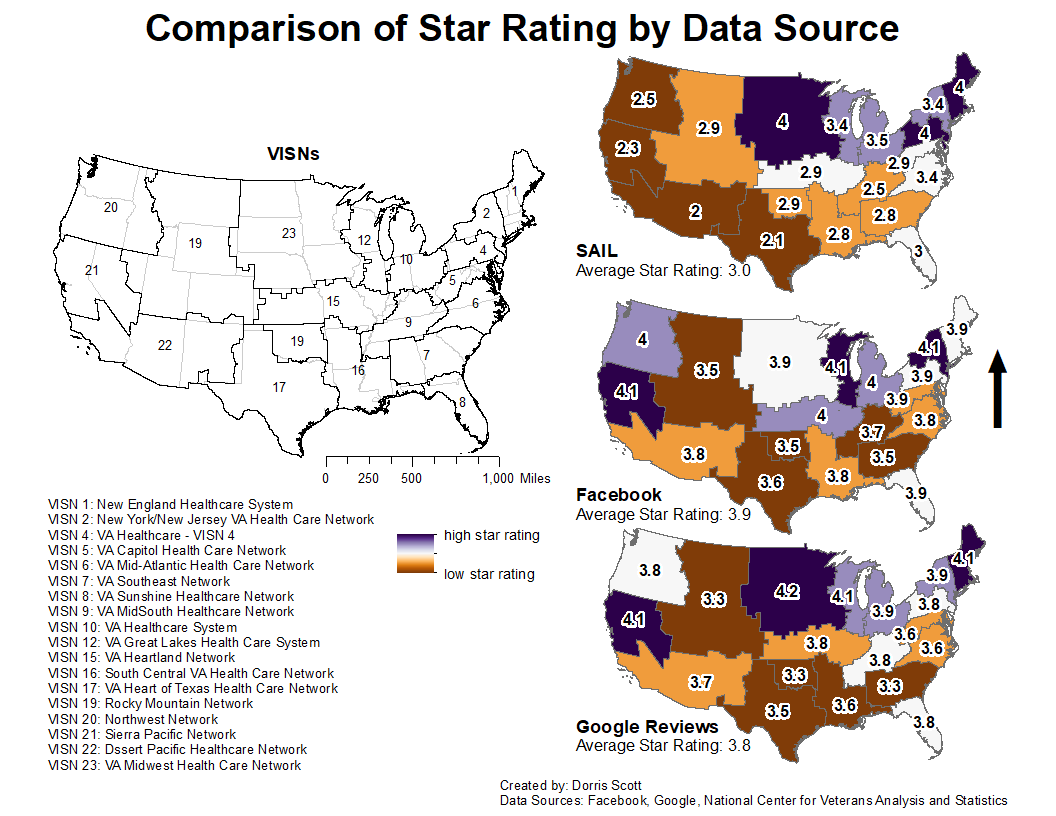
Based on this map, the average star ratings for the Facebook and Google star ratings were higher than the SAIL data. The average ratings for the SAIL data, Facebook star ratings, and Google star ratings were 3.0, 3.9, and 3.8 respectively. The Google star ratings and the SAIL star ratings show two of the same VISNs with the highest star ratings which are VISN 23 and 1. Based on the Facebook data, the VISNs with the highest star ratinsg are VISNs 21, 12, and 2. Both the Facebook and Google star ratings have VISN 12 and 21 as having the highest ratings, however in the SAIL data, VISN 21 had the lowest rating which indicates lower performing health facilities. Another interesting trend to note is the location of the higher and lower reviews. For the SAIL data, it appears that higher performing health facilities are in the northern and northeast areas of the country and the lower ratings are along the west. For both the Facebook and Google star data, higher rated health facilities tend to be in the north and northwest while there tends to be no concentration of low ratings in a specific location.
Difference between Internet Star Ratings and SAIL Data
How can we tell how much the internet reviews are consistent with the government produced measures? Using the Root Mean Square Error gives us insights on how consistent one data source is with another. This measure is an established, well-accepted measure for consistency. The bigger the value, the less consistent the measures are with each other.
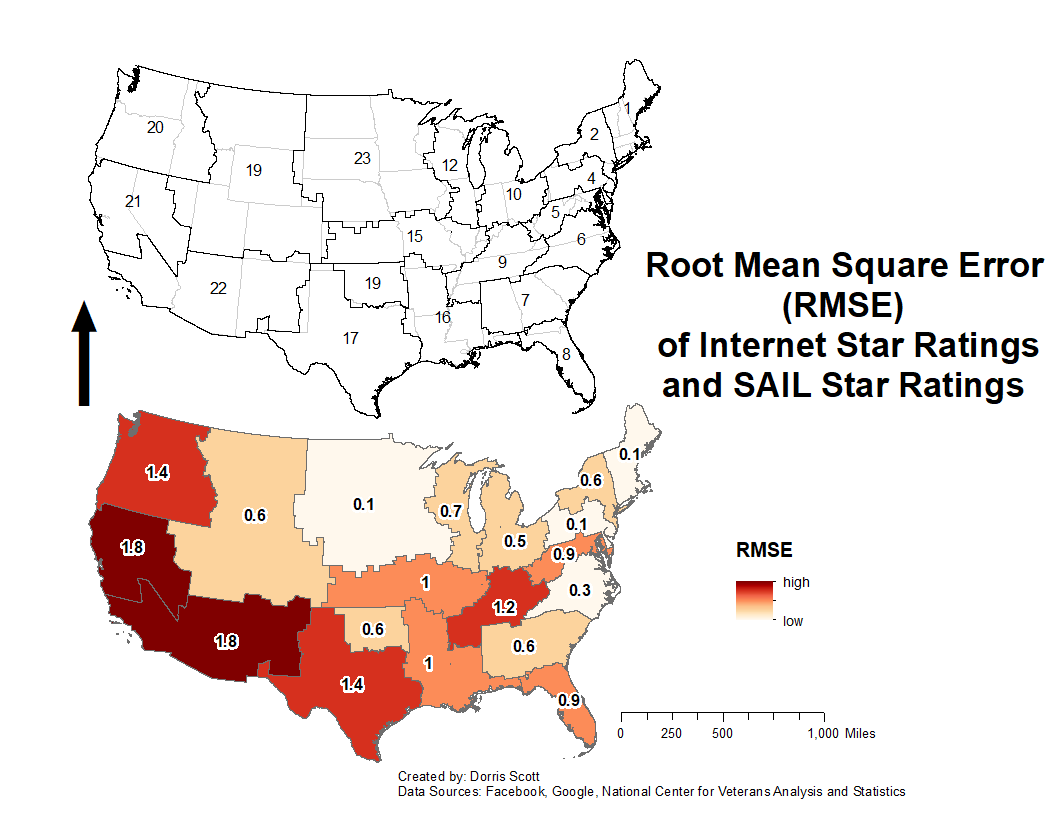
Among the 18 VISNs, VISNs 1,4, and 23 have the most consistent reviews across the three data sources while VISNs 21 and 22 had the least consistent reviews.
Hospital Ratings by VA Medical Facility
It is important to look at the star ratings by individual VA medical center and healthcare system to see how each facility is performing on an individual level. Doing so also serves as a point of comparison of which data source has star ratings in a geographic area.
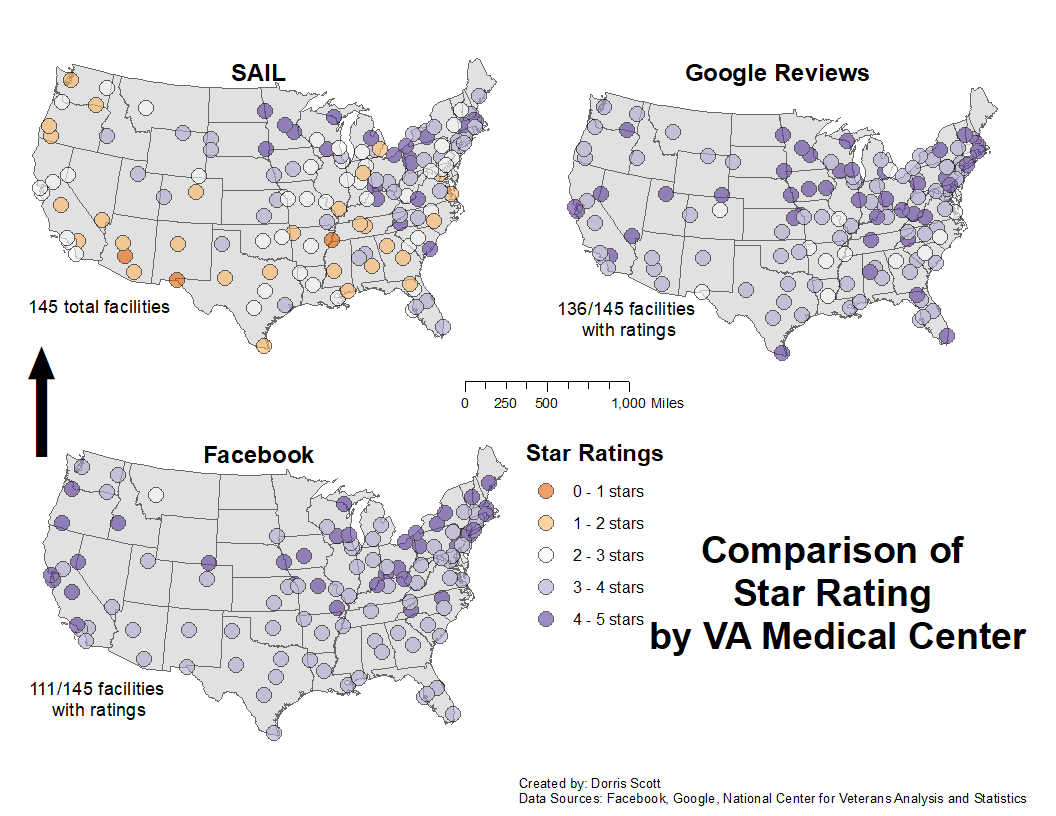
Out of all the three data sources, the SAIL data has the most star ratings for the VA medical centers nad healthcare systems, followed by Google and Facebook. The reason why the SAIL data had the most ratings is because the VA reports hospital performance for all VA medical centers and healthcare systems while Facebook and Google star ratings are user-generated. Even though the VA has Facebook pages for all its medical centers and healthcare systems, not all Facebook pages have the option for patients to give star ratings. Comparing the three maps, it appears that the Facebook and Google data have higher star ratings compared to the SAIL data and there is little variation between these two data sources. With the SAIL data, the states with the lowest rated medical facilities are Arizona, New Mexico, and Georgia.
Sources for VA Medical Center Quality Data
Access and Quality in VA Care. This site, created by the VA, provides information on various quality metrics such as patient satisfaction and how quickly a given VA medical center can see a patient. In addition, You can search for the nearest VA facility by state or VA parent facility. This was one data source that was used in creating the above maps.
Strategic Analytics for Improvement and Learning. This is quarterly released data on VA health facilities produced by the VA on various quality metrics.
Note: Information may not be current or accurate since the date of data retrieval.
Month and Year of Last Data Retrieval: October 2018.